Sage 300 CashView
[simple-author-box]
Cash flow is vital in any business. Knowing whether you have enough cash to pay salary, rental, suppliers and the many other activities in your business has always been a challenge for businesses. Your investment in Sage 300 is a positive step to better managing your finances. An Accountant using Sage 300 would be able to tell if you have sufficient funds to run the business. For someone who does not have the time to scrutinize the numbers on a regular basis, you would wish for a better solution. A solution that looks at all the numbers and have them presented in an easily understood manner, with option to go into details, if so desired.
CashView is a premier cash management tool designed with a dashboard approach that gives SMEs real-time view of their cashflow, timely alerts on cashflow shortages. By design, it’s a module that has an inbuilt cash flow Intelligence which will retrieve financial data, process them and determine if you are facing a cash flow crunch. This basically performs a forward-looking analysis so that the user is advised of a situation way ahead of time.
It’s simple and uncluttered interface hides all the complexities necessary to determine if there is a potential problem, projected into the future. It is a great tool if you just need a heads-up indication of how your business is fairing and at the same time offers targeted details that you can immediately focus on.
Benefits of using CashView:
- Provides users with a smarter way to manage cashflow
- Real time visibility of a company’s Cashflow, timely alerts on cashflow shortages.
- View current & future cash balance positions
- Know the business better with a simplified dashboard and reports showing the key financial metrics in the form of charts/widgets & statistical data
- Allows senior management staff (CEO, CFO etc.) who do not access SAGE300 to stay on top of things by having this add-on informing them as soon as a cash flow problem is encountered.
Dashboard
This screen presents financial metrics in the form of charts and widgets. These are the available metrics and the detailed information about them.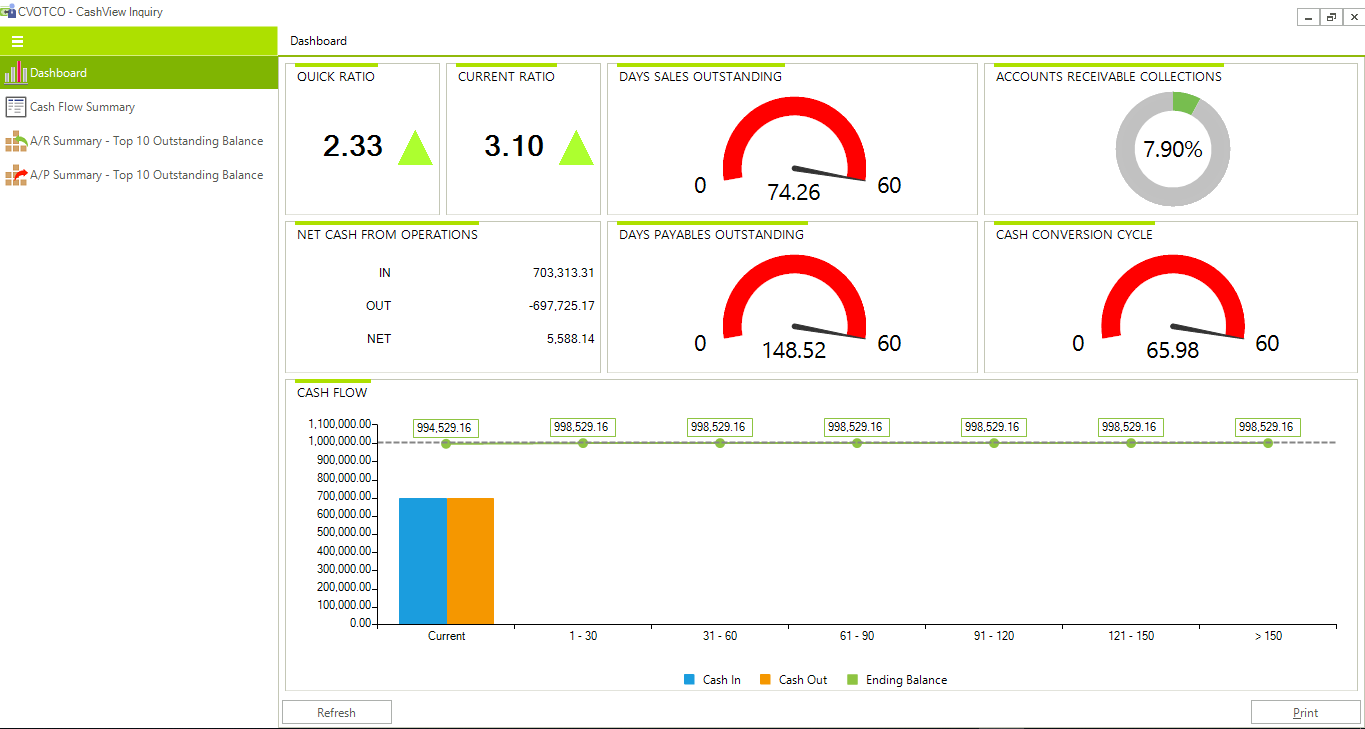
Cash Flow Summary
The cash flow summary screen uses a layout that shows how your cash flow status looks like over time (days’ ranges). Beginning from top row, it shows your cash position (based on amounts in your cash and bank accounts configured for this) over each days’ range after accounting for any movements during the period.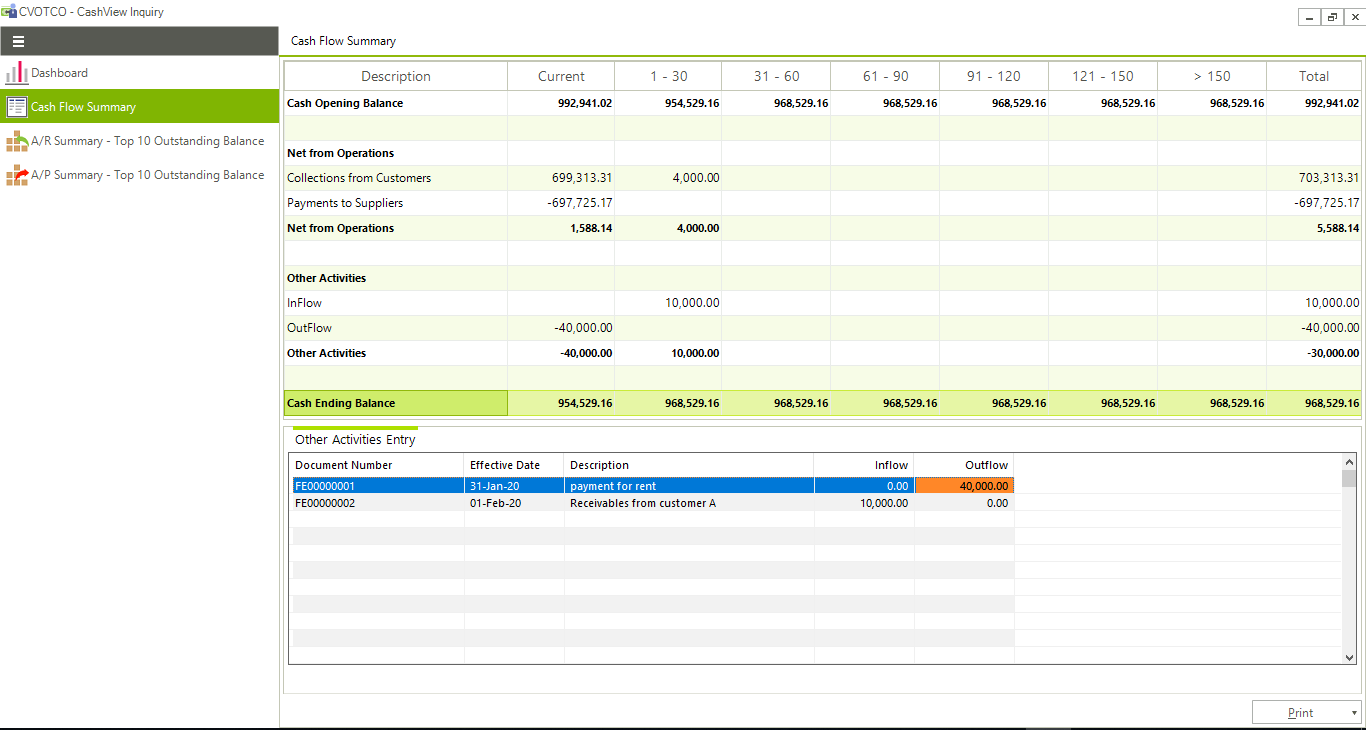
A/R Summary
This screen shows ten customers with the highest outstanding balance. It has information on the credit amount you have extended to them (in customer currency) and also the highest balance they reached in the year. This information is shown in a tabular form as well as in a horizontal bar chart. It also has 2 types of reports that you can print.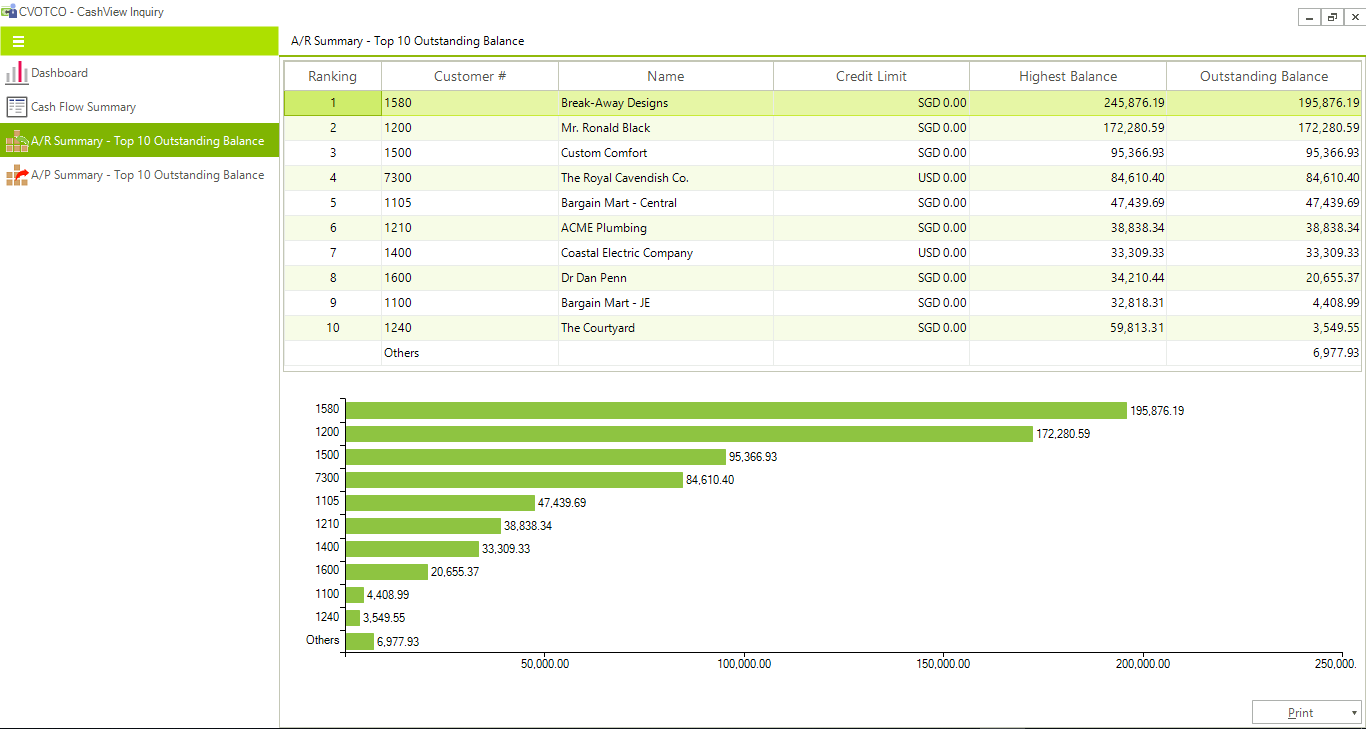
It also has 2 types of reports that you can print.
- Top 10 Customers by Outstanding Balance: This report shows the same information shown in the A/R Summary screen in the Inquiry function. It is useful if you need a copy of what you see in the screen. The information here is as at the last date and time when the cash flow data was refreshed. The Highest Balance in Functional Currency is not calculated in this module. It is the values maintained by the core A/R module. You can see this amount in the Customer Master.
- Receivables Forecast
- It provides for up to 7 ranges – Due plus 6 user defined ranges.
- It shows the percentage of balances for each range against the total outstanding for the Customer.
- It shows the percentage of balances for each range for all customers against the total outstanding for all Customers.
- Where multi-receipts are used, the report shows them separately with their calculated Due Date instead of treating them as due based on the first receipt due date. This is a better reflection of the receivables due.
A/R Summary
This screen shows ten vendors with the highest outstanding balance. It has information on the credit amount extended to your company by them (in the currency that you transact with them) and also the highest balance that you have reached in the year. This information is shown in a tabular form as well as in a horizontal bar chart.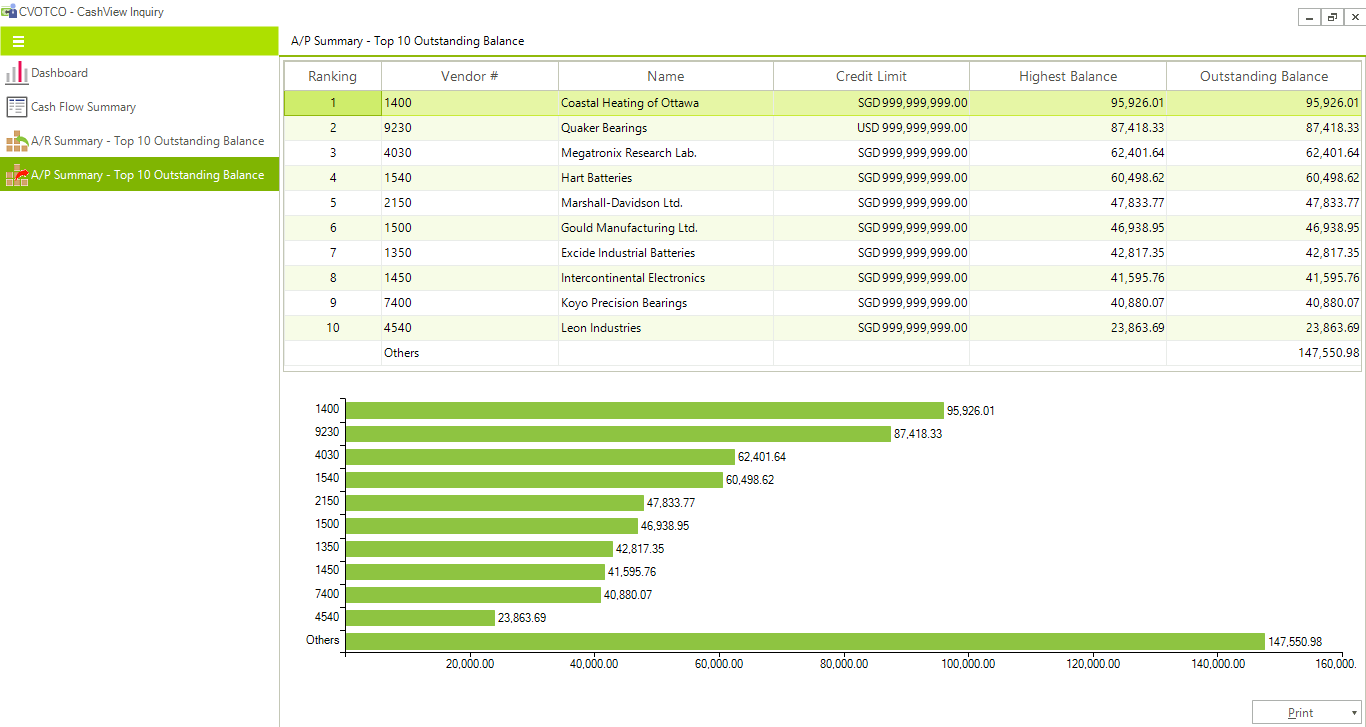
It also has 2 types of reports that you can print.
- Top 10 Vendors by Outstanding Balance This report shows the same information shown in the A/P Summary screen in the Inquiry function. It is useful if you need a copy of what you see in the screen. The information here is as at the last date and time when the cash flow data was refreshed. The Highest Balance in Functional Currency is not calculated in this module. It is the values maintained by the core A/P module. You can see this amount in the Vendor Master.
- Payables Forecast
This report provides a detailed look at the cash requirements over the projected future days’ ranges. Unlike the standard A/P Cash Requirements report in the Accounts Payable module, this report differs in the following areas:
- It provides for up to 7 ranges – Due plus 6 user defined ranges.
- It shows the percentage of balances for each range against the total outstanding for the Vendor.
- It shows the percentage of balances for each range for all vendors against the total outstanding for all Vendors.
- Where multi-payments are used, the report shows them separately with their calculated Due Date instead of treating.
In the News…
More Blogs…
40 Years Legacy of ZILLIONe
A Successful journey of Sri Lanka’s 2nd oldest IT company “ZILLIONe”
Team ZILLIONe is at the Microsoft Envision Forum Shangri-La, Colombo
Team ZILLIONe is at the Envision Forum today at Shangri-La Hotel, Colombo. Visit our stall at the Lotus Ballroom.
ZILLIONe is at the CA Sri Lanka CFO Forum as the Exclusive Sponsor
ZILLIONe is at the CA Sri Lanka CFO Forum as the exclusive sponsor for the event
ZILLIONe is a part of the National HR Conference organized by the CIPM Sri Lanka
ZILLIONe is a part of the National HR Conference organized by the CIPM Sri Lanka at the Bandaranaike Memorial International Conference Hall (BMICH) Visit https://lnkd.in/fSWJmmT for more information on the ZILLIONe HRM